Markers
Markers
Quick documentation

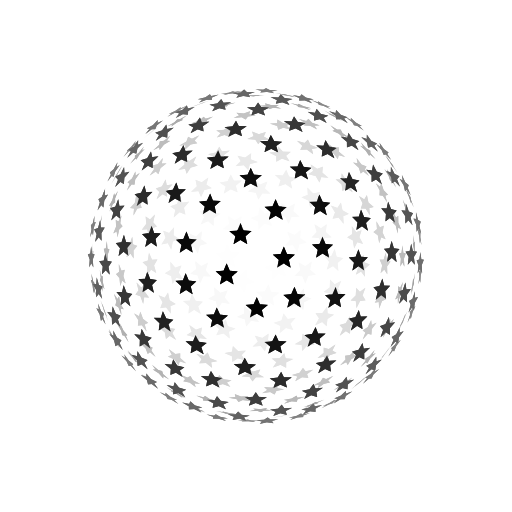
Markers are arbitrary two-dimensional polygons (including discs) with a given size that possess a surface that can be filled and stroked. They are flat but can be oriented towards any direction in space.
import numpy as np
import matplotlib.pyplot as plt
from gsp import core, visual, transform, glm

canvas   = core.Canvas(512, 512, 100.0)
viewport = core.Viewport(canvas, 0, 0, 512, 512)
camera   = glm.Camera("ortho")

n = 200
V = np.zeros(n, [ ("position", np.float32, 3),
                  ("size",     np.float32),
                  ("angle",    np.float32),
                  ("type",     np.float32),
                  ("color",    np.float32, 4) ])
R = np.linspace(0.25, 0.95, n)
T = np.linspace(0, 10.125*2*np.pi, n)
V["position"][:,0] = R*np.cos(T)
V["position"][:,1] = R*np.sin(T)
V["size"] = np.linspace(10, 20, n)**2
V["angle"] = 180*T/np.pi - 90
V["type"] = [core.Marker.heart, core.Marker.club,
             core.Marker.diamond, core.Marker.spade]*(n//4)
V["color"] = [(1,0,0,1), (0,0,0,1), (1,0,0,1), (0,0,0,1)]*(n//4)
black, white = core.Color(0,0,0,1), core.Color(0,0,0,1)

points = visual.Markers(V["position"], V["type"], V["size"],
                        V["angle"], V["color"], black, 0)
points.render(viewport, camera.transform)
plt.show()
__init__
__init__(
    positions,
    types=Marker.point,
    sizes=25.0,
    axis=None,
    angles=0.0,
    fill_colors=Color(0, 0, 0, 1),
    line_colors=Color(0, 0, 0, 1),
    line_widths=0,
)
Create a visual of n markers at given positions with given types, sizes, flll_colors., line_colors and line_widths. Markers can oriented individually along a given axis and angles.
Parameters:
| Name | Type | Description | Default |
|---|---|---|---|
positions |
Transform | Buffer
|
Markers position (vec3) |
required |
types |
Transform | Buffer | Marker
|
Markers types (marker) |
Marker.point
|
sizes |
Transform | Buffer | Measure
|
Markers sizes (float) |
25.0
|
axis |
Transform | Buffer | None
|
Markers vertical axis (vec3) |
None
|
angles |
Makers' angle aroudn their axis (float) |
0.0
|
|
fill_colors |
Transform | Buffer | Color
|
Markers fill colors (vec4) |
Color(0, 0, 0, 1)
|
line_colors |
Transform | Buffer | Color
|
Markers line colors (vec4) |
Color(0, 0, 0, 1)
|
line_widths |
Transform | Buffer | Measure
|
Markers line colors (vec4) |
0
|
render
Render the visual on viewport using the given model, view, proj matrices
Parameters:
| Name | Type | Description | Default |
|---|---|---|---|
viewport |
Viewport
|
Viewport where to render the visual |
None
|
model |
mat4
|
Model matrix to use for rendering |
None
|
view |
mat4
|
View matrix to use for rendering |
None
|
proj |
mat4
|
Projection matrix to use for rendering |
None
|